last edited Dec 11, 2019
Anguilla Climate and Weather
Location Map of Anguilla
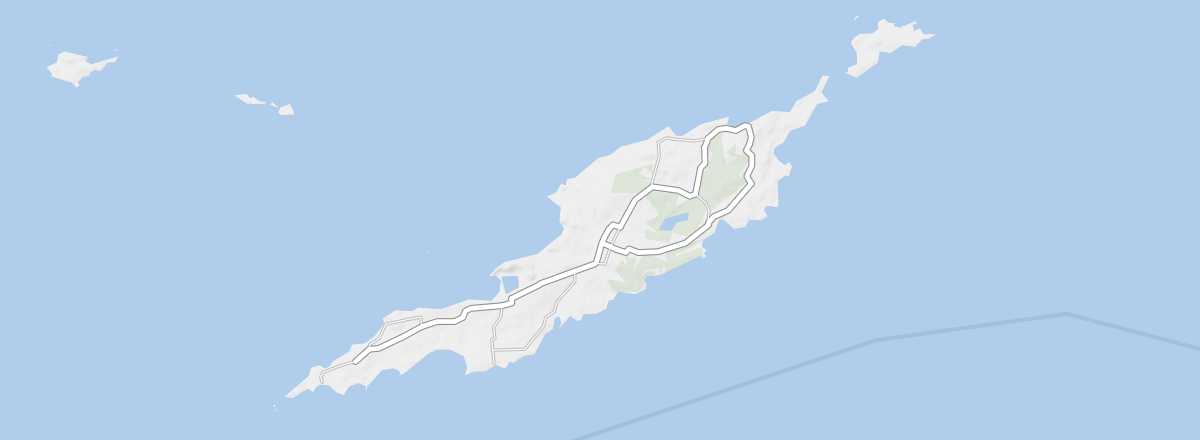 Anguilla
Open the interactive map
Climate Overview
Anguilla has a mild, dry tropical climate, thanks in part to the trade winds blowing from the northeast. Its average annual temperature hovers around 26/29°C, with July to October being the hottest months and December to February the coolest. Rainfall is relatively low compared to many other islands in the region, with less than 900 mm per year. The wettest period is from August to November, when hurricanes can occasionally hit the island. Conversely, February to March is the driest.
Best Time to Visit Anguilla Weather-Wise
The climate isn’t a major constraint for Anguilla, though it’s best to avoid the rainy and hurricane season between late July and mid-November.
| Jan. | Feb. | Mar. | Apr. | May | Jun. | Jul. | Aug. | Sep. | Oct. | Nov. | Dec. | |
|---|---|---|---|---|---|---|---|---|---|---|---|---|
| Climate | / | / |
: very favorable | : favorable | : moderately favorable | : unfavorable.
Sea Temperatures Throughout the Year
| Jan. | Feb. | Mar. | Apr. | May | Jun. | Jul. | Aug. | Sep. | Oct. | Nov. | Dec. | |
|---|---|---|---|---|---|---|---|---|---|---|---|---|
| Anguilla | 25 | 25 | 25 | 26 | 26 | 27 | 27 | 28 | 28 | 28 | 27 | 26 |